Monitor System Overview
Monitor is common for applications and especially essential for distributed systems. Metrics, the de facto standards for monitoring, has been pretty much everywhere beside micro-service area. Through metrics, system runtime, health, performance and etc data could be monitored, while analysis of historic dataset could also help us to disover system pitfalls as well as preventing instabilities.
Pandora.js provides a simple monitor mechanism which enhances Metrics to enable users to collect custom data in applications, what's more, auxiliary mechanisms were designed to help eternal system collecting and computing these data sets.
Data Collection
Pandora.js data collection is consist of several parts which could be divided to client and server for simplicity. Basically, one server is related to many clients, server accepts multiple clients' post data to summarize and store in memories.
Data collection was implemented using 'EndPoint' and 'Indicator'.
EndPoint Collection
Client side of data collection in Pandora.js is called indicator, it handles real logics and post data to server.
Server and client communicate throught IPC, the model can be expressed as the following picture:
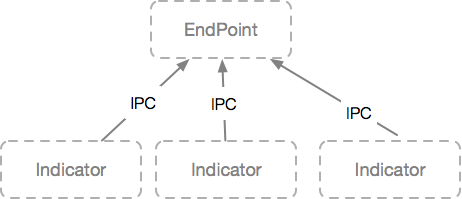
There are a few common EndPoint, such as health check, runtime data access and etc. Everything that is to be revealed by clients can be accomplished using EndPoint.
Metrics
Standarad metrics consist of the following standard types:
Gauge
Counter
Meter
Histogram
Pandora.js supports all of the above metrics, among which Gauge and Counter are more common.
Basic classes and implemented classes are offered for your choice.
Resource
During runtime of application, EndPoint could collect clients' data, but how to give users access to these metrics? Resource was designed to the rescue, it expose result of EndPoint through HTTP, by which users can explicitly access these results.
Reporter
This is another way of exposing data. Besides data collection, data storage, data analysis and data manipulation or processing are needed, but these are none of Pandora.js' reponsibilities, external AMP could acomplish this task, such as onApm or one-falcon, and this is where Reporter was used.
Reporter defined a series ways of data exporting, by default there are:
- ConsoleReporter: use console to output MetricsEndPoint content
- FileMetricsManagerReporter: use metrics.log file to output MetricsEndPoint content
Note: most of the time APM only has to collect MetricsEndPoint as an EndPoint, if frameworks or users want to collect other EndPoint, HTTP API exposed by Resource or other customized Reporter methods could be used.
Of cause custom Reporter is supported to post data to different targes, we also offer a few external APM Reporters, please refer to here for more information.