Metrics Usage and Extension
The Metrics is a big part of the whole monitoring system, which is based on EndPoint system to transport data, and simplified it to use.
the Metrics original design is refer to a indicator, that value has used to feedback the current status of the application. so the value of the Metrics all is a number.
In the industry, the Metrics have few standard types:
- Gauge - Transient value
- Counter - Counter
- Meter - Meter
- histogram - Histogram
the Pandora.js has currently made certain support for these metrics types, the most common used are the gauge type and the counter type, 80% of the situations are only used these two.
Quick use
We set up a MetricsClient client at the start of each process, but how the user gets it this object has become a problem. We designed a proxy class called MetricsClientUtil, you can get this class anywhere, for example:
import {MetricsClientUtil} from 'dorapan';
const client = MetricsClientUtil.getMetricsClient();

let counter = client.getCounter('test', 'test.qps.counter');
let histogram = client.getHistogram('test', 'test.qps.histogram');
let meter = client.getMeter('test', 'test.qps.meter');
let timer = client.getTimer('test', 'test.qps.timer');

counter.inc(1);
counter.dec(1);
histogram.update(5);
meter.mark(4);
We can easily to embed a Metrics indicator in anywhere through get a corresponding metrics method. you can open /metrics/:group to see the result of that Metrics you just did. More route methods for reference Reource.
Notice: All metric instances, all must be registered to the MetricsClient in order to be collected.
Because of the specific nature of the Gauge indicator, The Client cannot be created like getGauge. In this case, you can out the register() method. The definition show in below, and you can also see the API.
client.register(group: string, name: MetricName | string, Metric);
By the design, we can add a Gauge type indicator like below:
client.register('test', name, {
  getValue() {
  	return 100;
  }
});
The name of the indicator - MetricName
Each indicator can have a name, this name in the Pandora.js it not a simple string, but a MetricName type object.
The reference the MetricName type
The most common are the key and the tags.
The key is a normal string, joined by few strings with the separator dot(.), and the tags is a K/V object. the key and the tags identified a unique Metric.
Measurement type
Pandora.js is written by Typescript, and some code must be defined with type.
All metric types are inherited with Metric Interface
Transient metric
Most of the indicators are introduced from the transient gauge because it is the simplest, the most visual representation of the actual situation of data, nor the question of the time interval.
Gauge contains only one method called getValue, only implement this method when you want to use it. For example, if you want to know how the cpu of the current process works, you can solve it by Gauge.
<BaseGauge> {
  getValue() {
  	const startUsage = process.cpuUsage();
    return startUsage.user;
  }
}
Notice that all Metrics final output must be in the digital form, so that can be measured, if you want to output information about the string class, we have another output system, this will be introduced in the EndPoint.
Accumulative metric
Counter is the second introduction of the type, the counter is not the same with the Gauge, which is a cumulative type, suitable for recording the total number of calls and other types of data, such as the number of calls to an interface.
The following figure is the counter inheritance interface and implementation class.
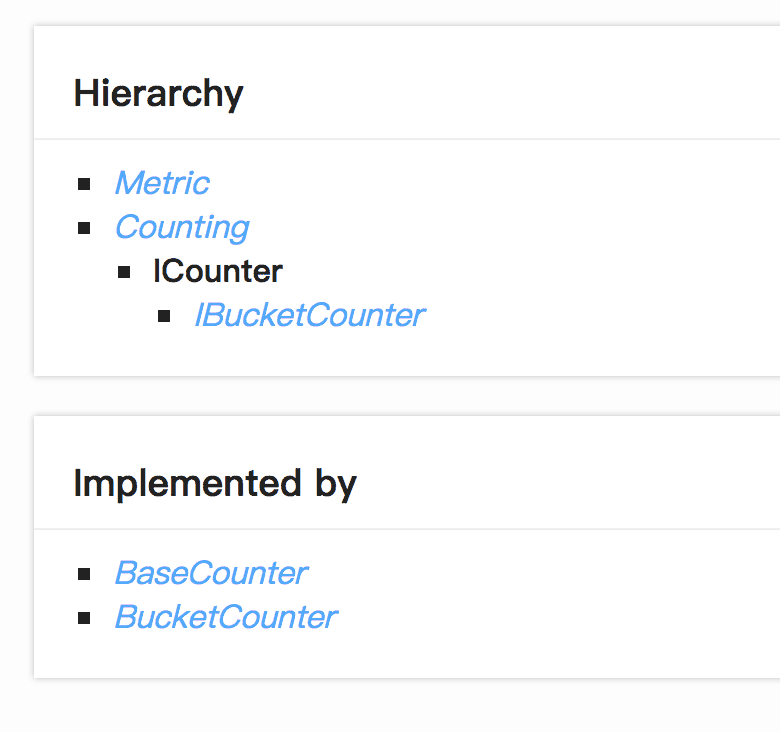
In addition to the basic BaseCounter implementation, we provide the BucketCounter.
The principle of sub-bucket counting is to define a time interval, which is divided into several buckets according to the time interval for a period of time, and each bucket keeps a count of the current time interval.
For example, the time interval is 5s, the total number of buckets is 10, then 0 ~ 5s is a bucket, 5 ~ 10s is the next one, and so on. When the counting execution time is 2s, then it will accumulate in the first bucket. If it is 7s, it will be accumulated in the second bucket, which is very easy to understand.
In actual scenarios, it is not advisable to save too much because of memory limitations. The amount of buckets can be limited. Circular queue storage is used to avoid data movement.
As a common example, record the number of koa service requests.
// The actual use needs to get BucketCounter from MetricsClient
let counter = new BucketCounter();

app.use(async (ctx, next) => {
  // add 1 counter.inc(1);
  counter.inc();
  await next()
});
Distribution metrics
The third one is the Histogram, a histogram of distributions. Pandora.js contains a BaseHistogram which can be used to count the response time of an interface and can show 50%, 70%, 90% of the request responses Time falls within which range you can calculate Apdex.
The distribution here for the time being only consider the stand-alone distribution, in the cluster dimension can not be calculated in this way.
For distributed computing, the core is to maintain a data set Reservoir, the data set is used to provide data storage and get the current snapshot Ability. The most important of these is the strategy of data updating. At present, Pandora.js only implements the realization of UniformReservoir and Exponentially Decaying Reservoir. Since random sampling does not perform well in weighting, the default is the index Attenuated random sampling, other sampling algorithms are not realized, interested students can add.
Take a common example, record the success rate of koa services, the use of random sampling algorithm, an interval of 1s, 2 sub-barrel, show access to the average and other information.
// The actual use needs to get BaseHistogram from MetricsClient
let histogram = new BaseHistogram(ReservoirType.UNIFORM, 1, 2);

app.use(async (ctx, next) => {
  histogram.update(10);
  histogram.update(20);

  // other biz
});

// let snapshot = histogram.getSnapshot();
// expect(snapshot.getMean()).to.equal(15);
// expect(snapshot.getMax()).to.equal(20);
// expect(snapshot.getMin()).to.equal(10);
// expect(snapshot.getMedian()).to.equal(15);
Rate metric
The fourth one, Meter, is a gauge that measures throughput over a period of time. For example, one minute, five minutes, fifteen minutes qps indicator.
Here we should point out that the rate of change, we generally care about two places, one is instantaneous burst, beyond the usual normal very high such fluctuations, and the other is a trend over time, from an average point of view A measure of the overall measure, this approach will be the average point of view.
The former concept of using Rate in Metrics only records the cumulative total number of events. There is an external system to calculate the instantaneous rate by taking acquisitions twice before and after, which is what we call Rate here.
In the calculation of rate, we think the data growth is linear. It is calculated as: rate = (v2 - v1) / (t2 - t1), where the unit of time is s.
The benefit of this is that by adjusting the acquisition frequency, instantaneous rate calculations can be supported at any time interval. But the downside is that when the system reboots between samples, a negative number is calculated and some of the data is lost.
The latter is calculated by the Exponential Weighted Moving Average (EWMA).
For rate-based metrics, we provide 1 minute (m1), 5 minutes (m5) and 15 minutes of EWMA (m15) to reflect the rate changes of 1 minute, 5 minutes and 15 minutes respectively from the current time point.
The specific method of calculation, and Linux system load1, load5, load15 calculation method is exactly the same. That is, the instantaneous rate is counted every 5 seconds and applied to the following recurrence formula:
EWMA(t) = EWMA(t-1) + alpha * (instantRate - EWMA(t-1))
The alpha value ranges from 0 to 1, which is called the attenuation coefficient. The larger this coefficient is, the faster the weight of the older data decays from the current time point.
Take a common example, record koa routing of a call rate.
// Actual use needs to get BaseMeter from MetricsClient
let meter = new BaseMeter();

router.get('/home', async (ctx) => {
  meter.mark(1);
});

// meter.getMeanRate(); Divide the total by time
// meter.getOneMinuteRate(); // One minute EWMA
Aggregate metric
Here to introduce a special indicator, he is equivalent to the aggregation of multiple indicators.
export abstract class MetricSet implements Metric {

  type: string = MetricType.METRICSET;

  /**
   * A map of metric names to metrics.
   *
   * @return the metrics
   */
  abstract getMetrics(): Array<{
    name,
    metric
  }>;
}
MetricSet contains an abstract getMetrics () method that returns the final multiple Metrics, and we use it to implement an upper CachedMetricSet that caches metrics for different periods of MetricsLevel.
Here's a simple example:
class TestCachedMetricSet extends CachedMetricSet {

  caches;

  getValueInternal() {
    this.caches = {
      a: Math.random(),
      b: Math.random(),
    };
  }

  getMetrics() {
    let results = [];
    let self = this;

    results.push({
      name: MetricName.build('test.a'),
      metric: <BaseGauge<any>> {
        async getValue() {
          await self.refreshIfNecessary();
          return self.caches['a'];
        }
      }
    });

    results.push({
      name: MetricName.build('test.b'),
      metric: <GaugeProxy<any>> {
        async getValue() {
          await self.refreshIfNecessary();
          return self.caches['b'];
        }
      }
    });

    return results;
  }

}
Two Gauge metrics are returned via the getMetrics () method. These two metrics are returned by the value of the internal cache. RefreshIfNecessary () is used to refresh the internal cache value.
Most of the built-in metrics such as CPU, memory, etc., are based on CachedMetricSet, for more on code.
Although registration is an indicator, the final display is broken down into several separate metrics.