Debugging Application
Start application on local command lines
If the installed Pandora.js is installed globally, use the following command(if there is a start parameter, as with the start command).
pandora dev
If it was installed within the project:
add(or update) field
scriptinpackage.json. Making the following changes topackage.json:
{
  "script": {
      "dev": "pandora dev",
  }
}
Then run
npm run devto start the application locally.
Inspector
Execute the following commands:
pandora dev --inspect
View command line output, similar to the following:
Debugger listening on ws://127.0.0.1:60587/a8217114-d61a-4789-8426-da350a88c1da
For help see https://nodejs.org/en/docs/inspector
Use the node-Inspector, chrome devtools, and other tools to connect to the related ports for debugging.
In this example, you need to connect to 127.0.0.1:60587.
IDE:Debugging in WebStorm(or other IntelliJ's IDE)
Configure according to the following image:
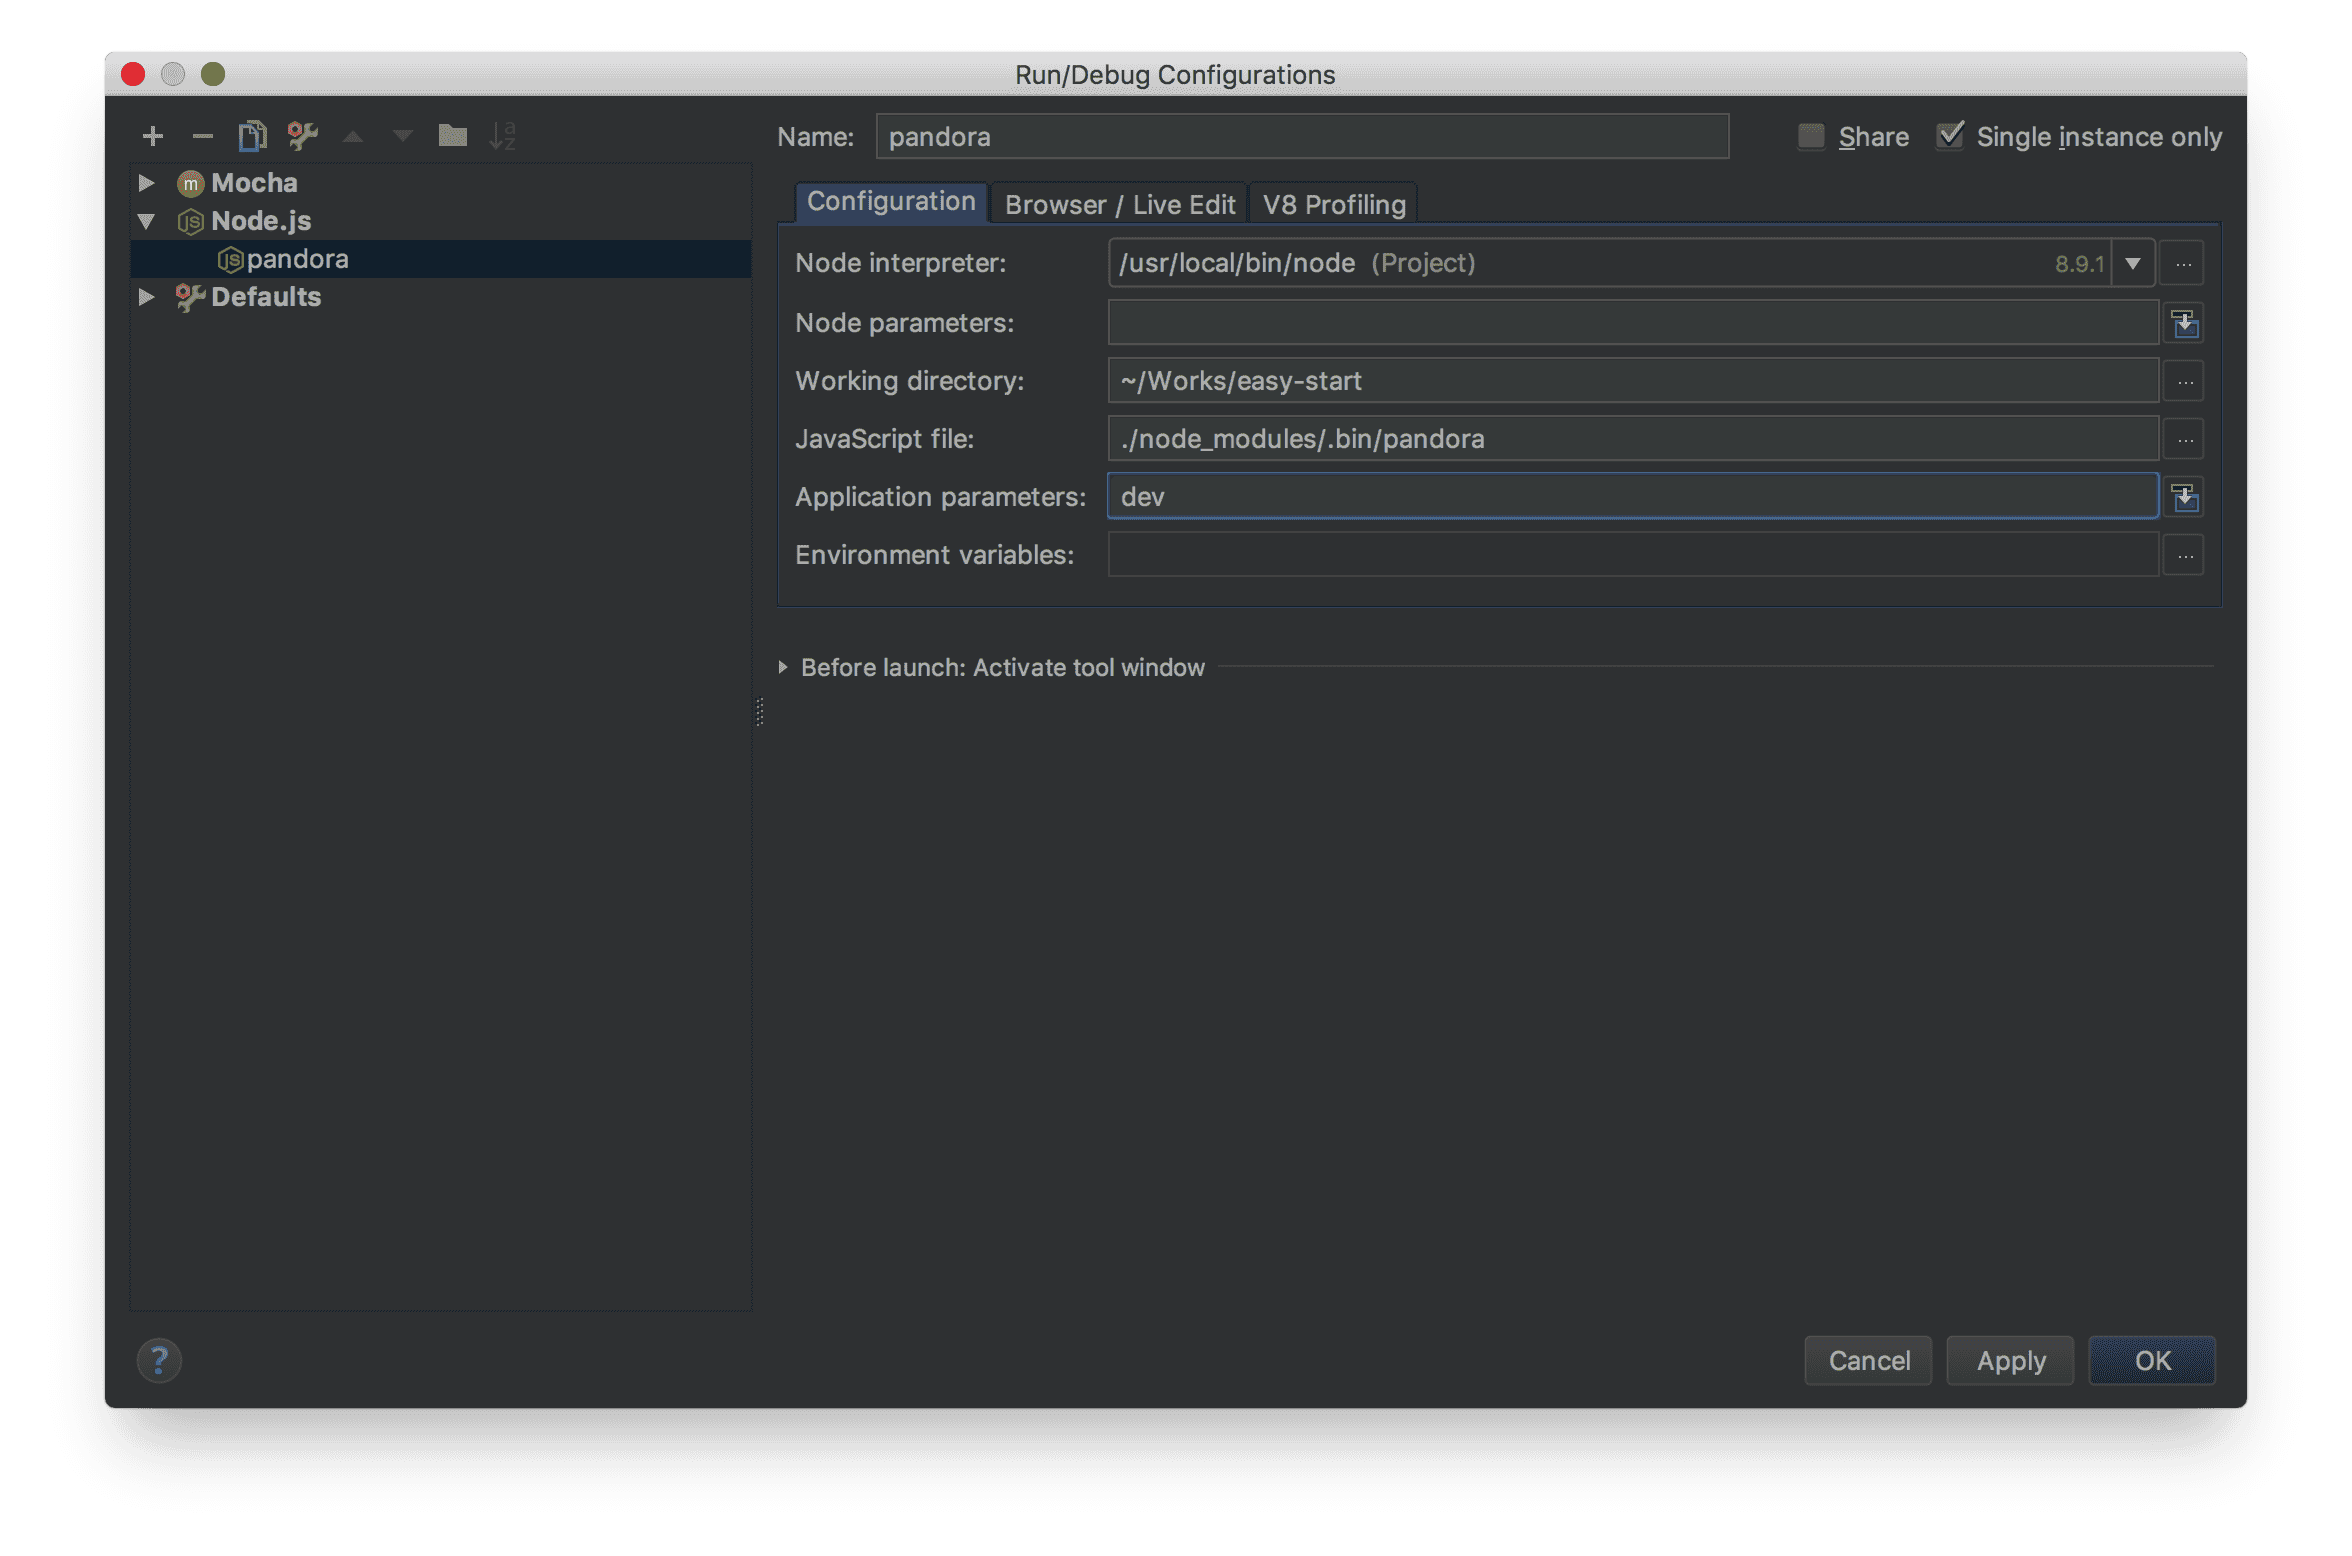
Key Point:
Working directory:fill with the project root directoryJavaScript file:fill with Pandora.js bin file path- If it's locally, that's
./node_modules/.bin/pandora - If it's globally,you can find it by running
type pandorain the command line. Application parameters:fill withdev
The above configuration is equivalent to running the pandora dev with WebStorm.
Attention:It depends on the WebStorm's feature - Node.js Multiprocess Debugging, too low version of WebStorm may have problems, Related Issue。
Other IDE
If other IDE also supports the Node.js Multiprocess Debugging is also available, if not supported, let us know.
For now, other IDE can use pandora dev --inspect start application,
then debugging with connecting the port(such as the Node.js Remote Debug in WebStorm).
In order to make other ide quickly debug, we are making a proxy for the Node.js debugging protocol.